York County · Pennsylvania
Radon Geology of York County, PA
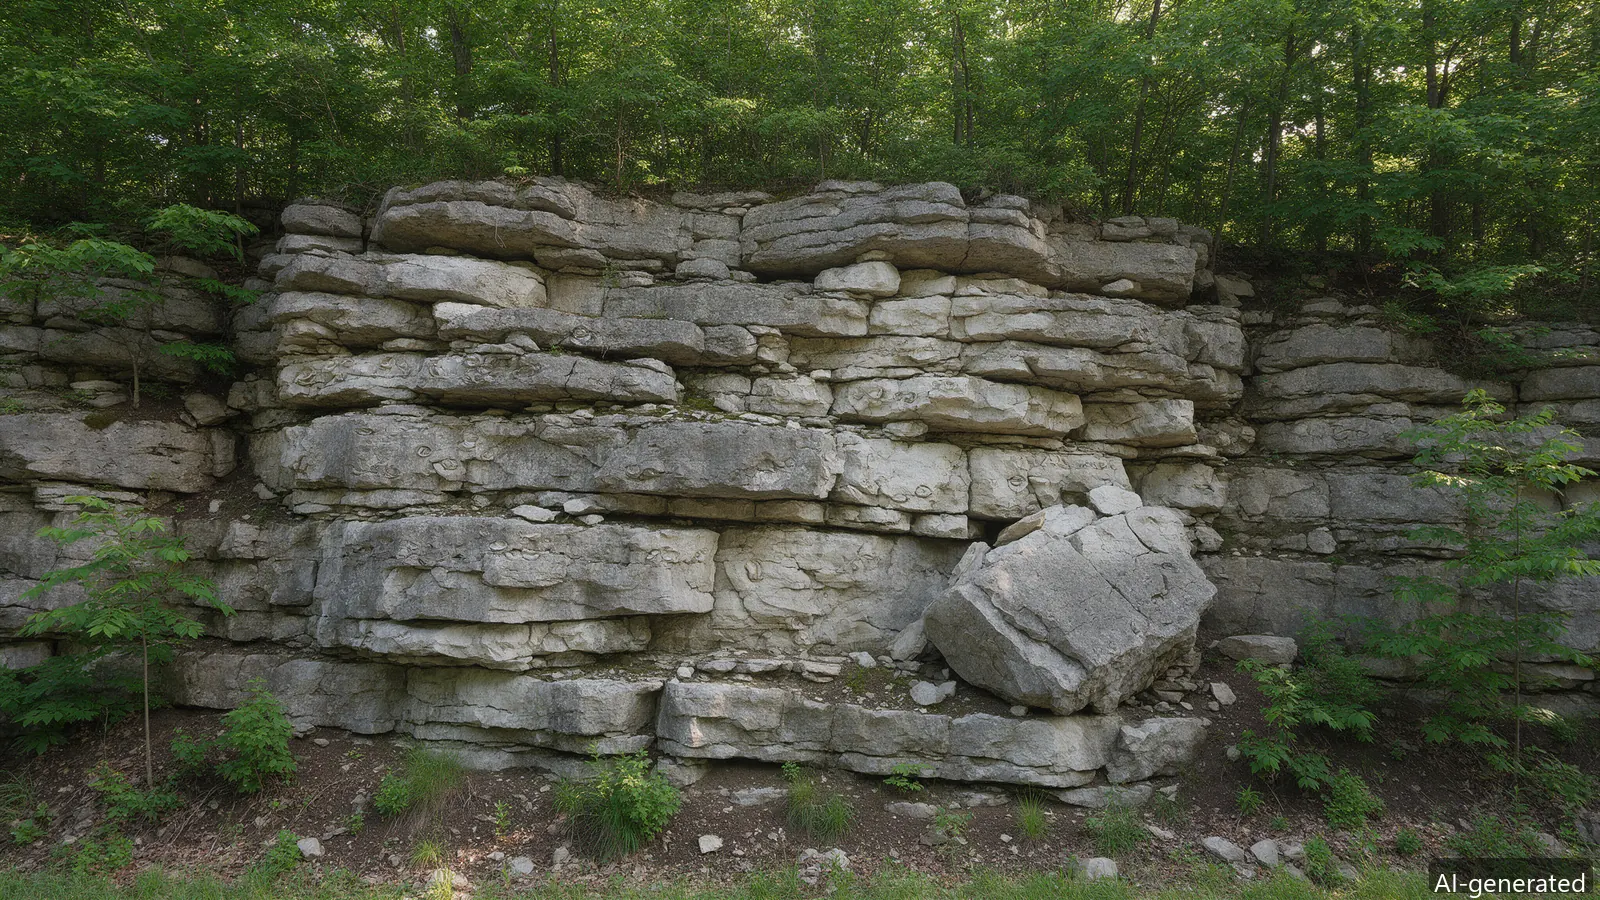
The PA Geological Survey’s county mapping (County Report 67) divides York County into three geologic belts, each feeding radon differently:
All of York County is EPA Radon Zone 1, and PA DEP’s ZIP-level test data shows roughly 56% of county basement tests at or above the 4.0 pCi/L action level. The rock sets the supply; the house sets the entry. Two homes on the same street can differ tenfold — the test, not the geology map, decides your number.
USGS adds a water angle: 87% of sampled Pennsylvania groundwater wells exceeded 300 pCi/L dissolved radon, with the highest readings in the Piedmont schists and gneisses that ring this county — the well-water page covers that fix.
The Peach Bottom district’s slate mined for roofing carries a uranium signature — the same decay chain that made it an ore prospect makes its soil gas radon-rich. Homes on the southern tier sit closest to that source rock, and DEP’s ZIP-level records read consistently high there. What varies is delivery: slate’s deep saprolite soils breathe slowly through broad areas, so systems there often need broader sealing plus standard suction rather than heroic fan pressure — the diagnostic decides, per house, not per belt.
Limestone dissolves along fractures into voids that connect like pipes: soil gas in the York Valley moves in channels rather than through pore space. That makes valley sub-slab communication excellent — one well-placed suction point canserve a broad slab — while the same karst channels can short-circuit a poorly located one. The communication test’s pressure readings mean different things in valley ground than in slate saprolite or Triassic sandstone, which is the practical reason geology appears on the diagnostic report at all.
The same decay chain loads well water as dissolved radon, and USGS’s sampling found 87% of tested Pennsylvania groundwater wells above 300 pCi/L — a second, airborne-at-the-shower exposure route the soil system does not touch. Rural properties on the uplands and near the slate belt test both: air in the basement, water at the pressure tank. The two files are separate; fixing one says nothing about the other, and the well-water page covers the aeration and carbon routes.
Three radon-producing rock belts (PA Geological Survey): the carbonate York Valley with karst fractures, the Peach Bottom uranium-grade slate belt, and the Triassic uplands.
Both. The rock sets the supply; the house sets the entry — stone foundations, slab cracks, sumps, stack effect. Neighboring homes can differ tenfold.
Yes — USGS found 87% of sampled Pennsylvania groundwater wells exceeded 300 pCi/L of dissolved radon, with the highest readings in the Piedmont’s schists and gneisses (which ring this county). Showers and dishwashers aerosolize it; the fix is water treatment, not a soil fan.
Zone 1 = predicted average indoor screening level above 4.0 pCi/L. All of York County is Zone 1. It predicts the county, not your house — neighboring homes differ — so the test, not the map, decides.
EPA attributes about 21,000 U.S. lung-cancer deaths a year to radon — the second cause after smoking and the first among never-smokers (~2,900 deaths/year). WHO estimates 3–14% of all lung cancers. Risk rises roughly 16% per 100 Bq/m³ of long-term exposure (WHO pooling studies).
No level is zero-risk. EPA’s action guideline is 4.0 pCi/L; WHO recommends acting at 2.7 pCi/L (100 Bq/m³) and set 300 Bq/m³ as the absolute maximum national reference. At 4.0 pCi/L, EPA’s tables project ~62 lung cancers per 1,000 smokers and ~7 per 1,000 never-smokers over a lifetime.